The cases logged in your support system are not random. They follow patterns. The job of Knowledge Base Effectiveness is to identify the patterns and club them into clusters for visualization so that you can analyze the cases and the knowledge coverage at a glance.
Case Clusters
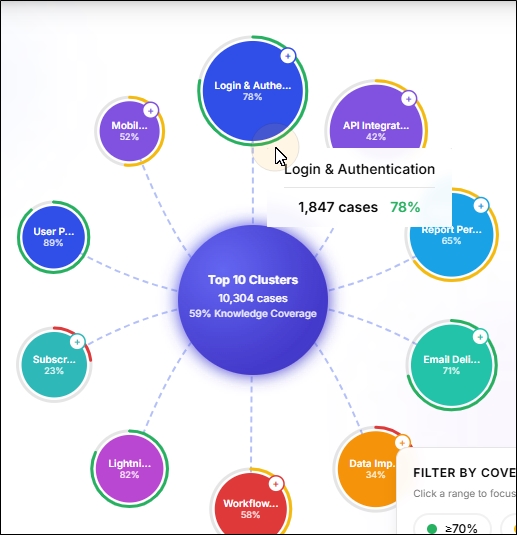
In the next image, you can see ten bubbles around a central informational bubble. Each bubble on the boundary is a cluster. These clusters have been formed by categorizing the cases logged in your case management software into ten groups. Hover your cursor over a bubble to view the cluster name and the number of cases in that cluster.
Fig 1. A snapshot of the "Login & Authentication" cluster with 1,847 cases.
For case management software handling a large volume of cases, a division into ten clusters is great, but not something that elicits a "Wow!" It's akin to knowing that the restaurant you want to dine at is within a five mile radius. It's helpful in a way. It's even reassuring because you know that you're near your goal. but the practical value from this information is limited.
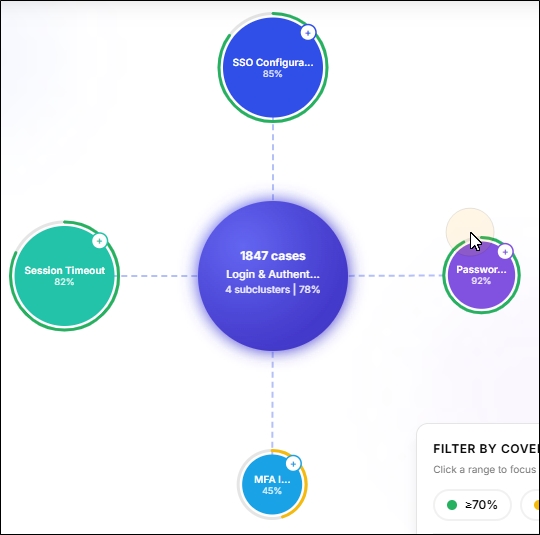
For this reason, the clustering in Knowledge Base Effectiveness is two-layered. The "Login & Authentication" cluster shown in Fig. 1 can be split into sub-issues (Fig. 2), such as "Session Timeout", "Password Reset", "SSO Configuration" and "MFA Issues".
Fig. 2. A snapshot of the four level 2 subclusters of "level 1 cluster Login & Authentication".
Knowledge Base Effectiveness supports two levels of clustering. In each level you can visualize a maximum of 10 clusters. It means that you can visualize up to 100 clusters for a support database. That provides the accuracy each support team manager desires.
Note. The clusters are created at the end of each month.
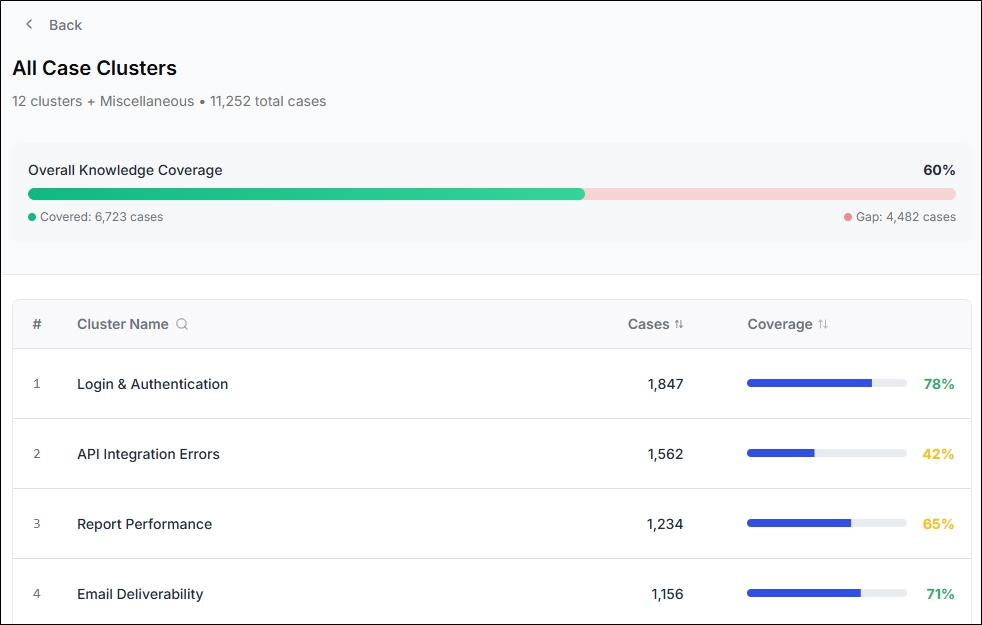
Although the visualization is limited to 10 clusters, if Knowledge Base Effectiveness creates more than 10 clusters after an analysis of your case data, then all the clusters can be viewed as a list.
Fig. A snapshot of the Case Clusters list when the number of clusters is more than ten.
Article Clusters
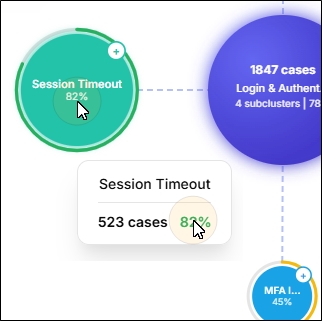
Look at the cluster bubbles again. You will notice a piece of information that we haven't talked about yet. It's a number stacked right under the cluster name. That number shows up when you hover the cursor over a cluster. That number is called Knowledge Coverage.
Fig 3. A snapshot of Knowledge Coverage on a cluster.
Like cases, the knowledge articles in your support database aren't random. If your company sells Linux distributions, then the knowledge articles are going to be about how to install the distribution, how to manage add or remove packages, and so on. In other words, if you were to analyze, you would find many patterns.
After an analysis of the cases and knowledge articles, Knowledge Base Effectiveness
matches this data to produce a comprehensive report on how well your knowledge base is
tuned to the needs of the customers. A score of 82% in Fig. 3 indicates
that eighty two out of hundred cases have at least one matching knowledge article
which helps the customer solve the case.
As a support manager or content manager you can analyze the remaining 18%
cases and create knowledge articles for them. The next sections will show you
how to identify the mismatch between what the customers seek (case clusters)
and knowledge base (article clusters). It also shows how to use Knowledge Base
Effectiveness to reduce or eliminate the gap between knowledge desired by
your customers and the knowledge produced by your team. The next image
illustrates the cases for which no help article exists in your knowledge base.
Fig. A snapshot of the Cases for which no knowledge article exists.
Navigation
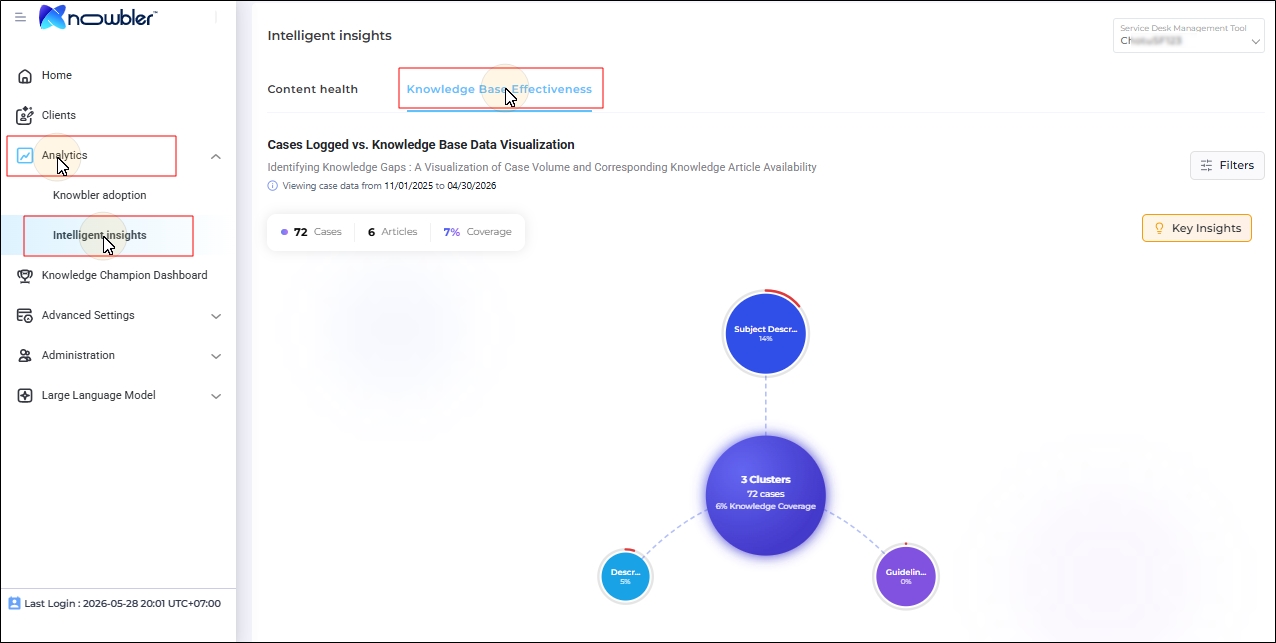
Log into Knowbler.
Expand Analytics.
Click Intelligent Insights > Knowledge Base Effectiveness.
Select a Service Desk Management Tool.
Report
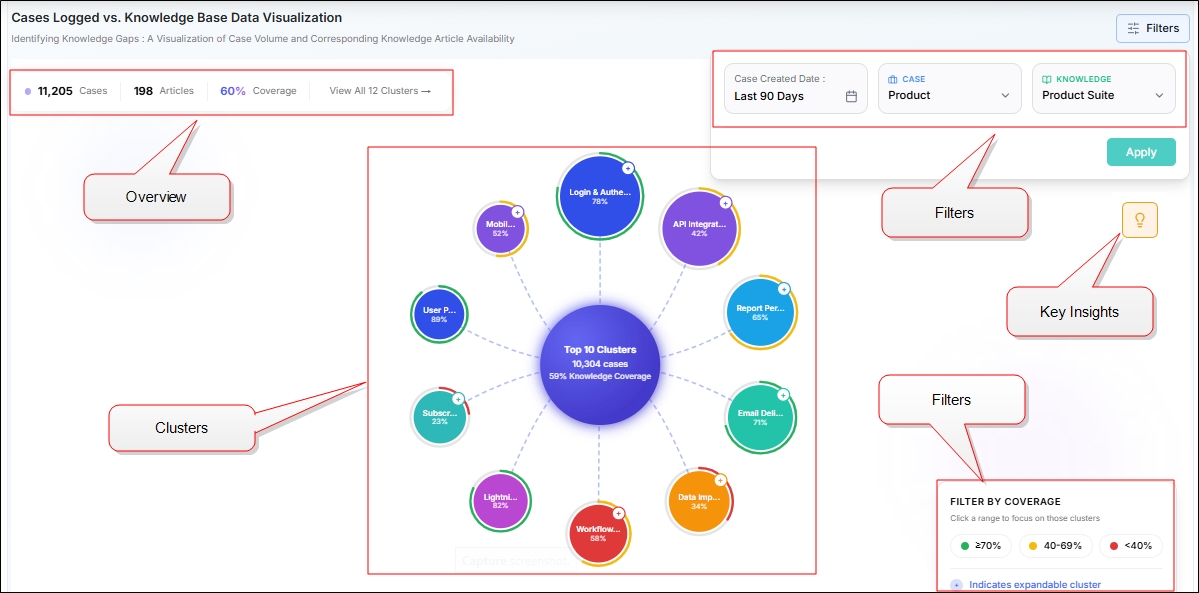
The report consists of four parts:
Overview
Filters
Key Insights
Clusters
Overview
You can have three or, if the number of clusters is more than 10, four pieces of information in Overview.
Cases shows the total number of cases logged in your system in the selected date range
Articles shows the total number of help articles created in the selected date range.
Coverage is the number of cases for which at least one help article exists. These articles help the users solve the cases. To add a filter, follow the instructions given in Analytics Settings.
View All <number> Clusters is a button. It's visible if the number of clusters is more than 10. Clicking on this button takes you to a cluster table. More information about how to read the cluster table is in the section clusters.
Fig. A snapshot of the Overview section on Knowledge Base Effectiveness.
Filters
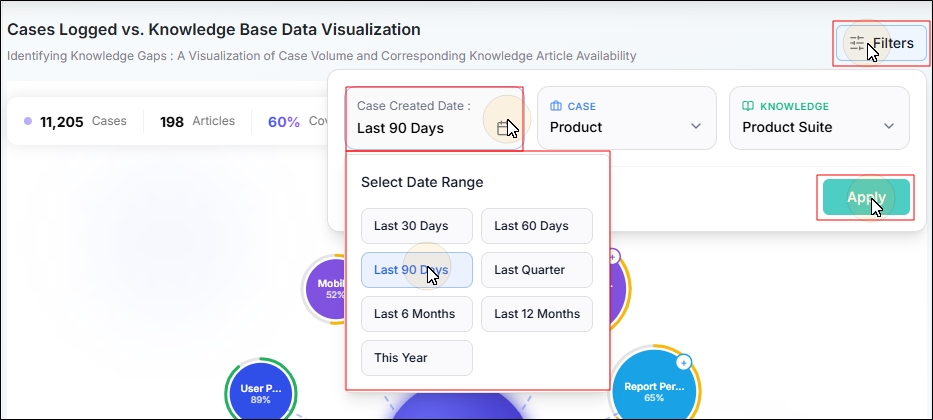
Date, Field, and Overlap filters are available in the report.
To view the Date and Field filters, click on Filters.
To view clusters for a specific period, use the Date filter.
After selecting a time period, click Apply. The default period is 90 days.
Fig. A snapshot of the Date filter on Knowledge Base Effectiveness.
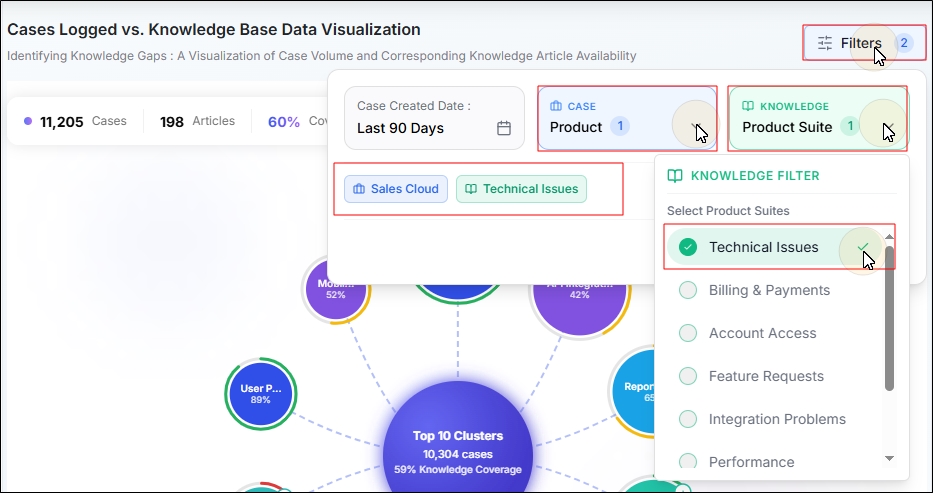
To view clusters for a specific case field and knowledge field values, use the Field filters.
These filters are available only if you've configured them in
Analytics Settings.
After selecting the filters, click Apply.
In the next image, the value "Sales Cloud" has been used from the case field
"Product" and the value "Technical Issues" has been used from the
knowledge article field "Knowledge". The cluster view for these
fields will display all the cases about the product “Sales Cloud”
and their overlap with all the knowledge articles tagged “Technical Issues”.
Fig. A snapshot of the Fields filters on Knowledge Base Effectiveness.
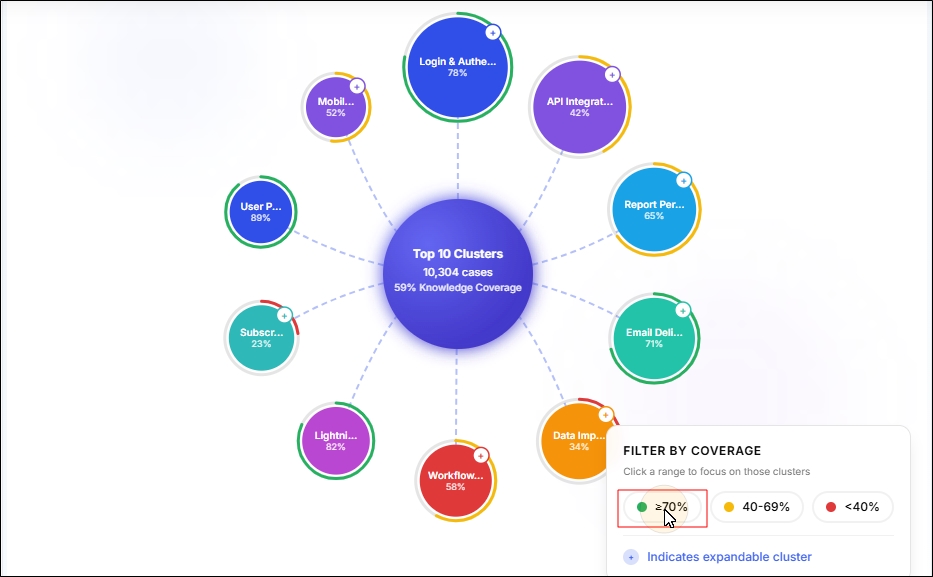
To view clusters where the case-article overlap score is within a specific range, use the Overlap filter.
Fig. A snapshot of the Overlap filter on Knowledge Base Effectiveness.
Key Insights
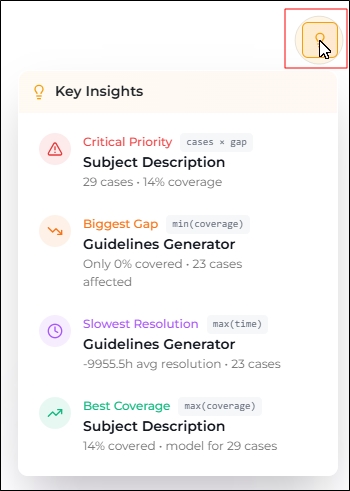
Key Insights are visible on the Level One of Clusters. Click on the bulb icon to open a dialog which lists four clusters.
Fig. A snapshot of the Key Insights dialog on Knowledge Base Effectiveness.
The four clusters in the list are:
Critical Priority displays the cluster with the highest
combined impact of case volume and knowledge gap. It is counted as
the
Biggest Gap displays the cluster with the lowest knowledge coverage percentage.
Slowest Resolution displays the cluster that has the highest Avg. Resolution Time
Best Coverage displays the cluster with the highest knowledge coverage
You can click on these clusters to view cluster details.
When you click on a cluster to view details, the cluster shows
either sub-clusters or a side-drawer. More information about the
side-drawer is in the next section Clusters.
Clusters
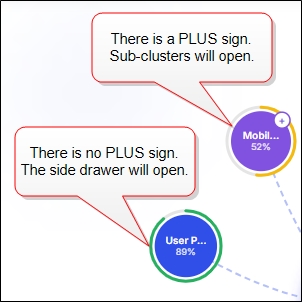
Clicking on a cluster either reveals the subclusters
or opens a side-drawer. If a cluster has a PLUS sign,
the subclusters will open. If it doesn't have a PLUS
sign, then you'll see a side-drawer.
Fig. A snapshot of two clusters.
Clicking on the upper cluster opens sub-clusters.
Clicking on the lower cluster opens a side-drawer.
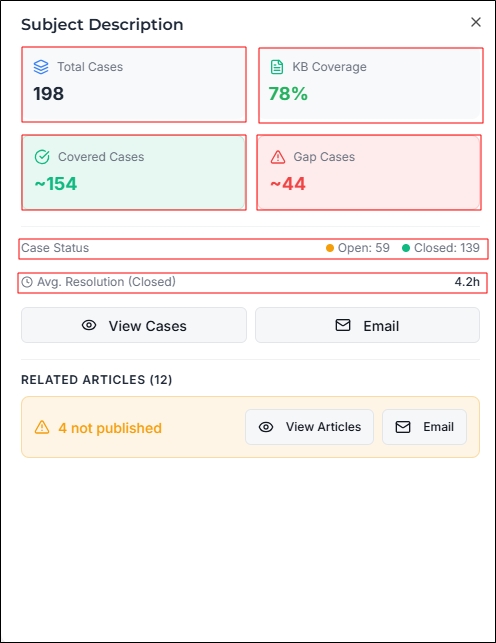
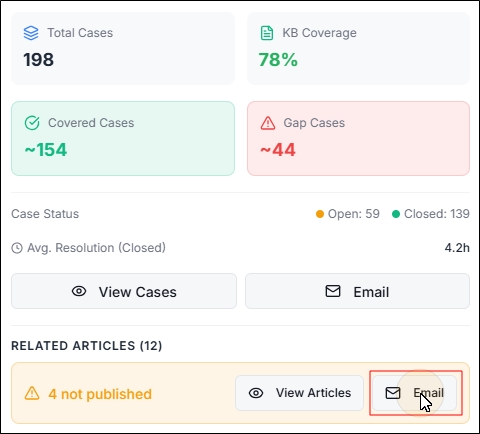
The side drawer presents seven pieces of statistics right away, with the option to explore more. The statistics on the tab are:
Total Cases: The total number of cases logged into your case management system in the given Date Range.
KB Coverage: The share of cases for which at least one knowledge article exists.
Covered Cases: The number of cases for which at least one knowledge article exists.
Gap Cases: The number of cases for which no knowledge article exists.
Case Status: Open: The number of cases that are open.
Case Status: Closed: The number of cases that have been closed.
Average Resolution Time (Closed): The average time taken to close a case.
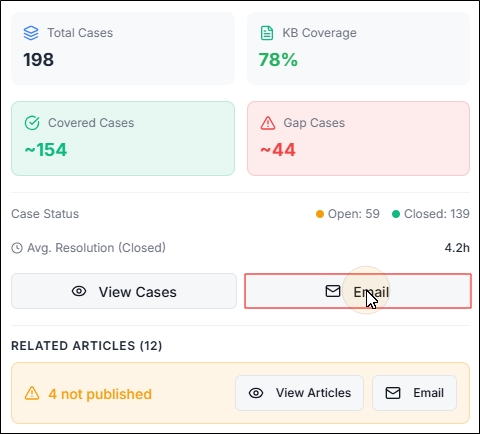
Fig. A snapshot of the information available on the side-drawer.
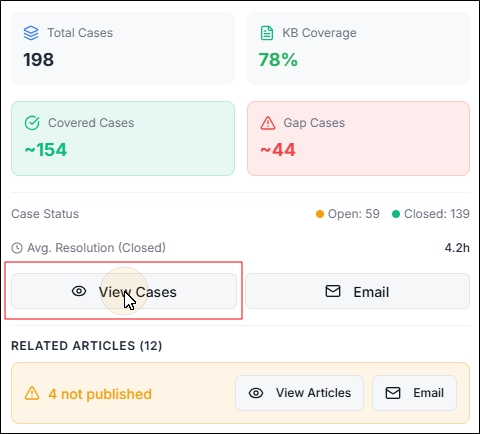
View Cases
You can dig deep by clicking View Cases.
Fig. A snapshot of the View Cases button on the side-drawer.
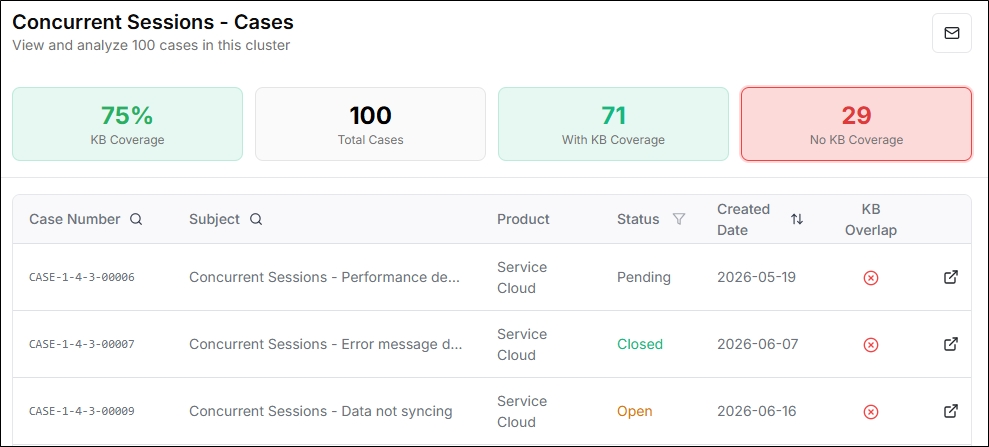
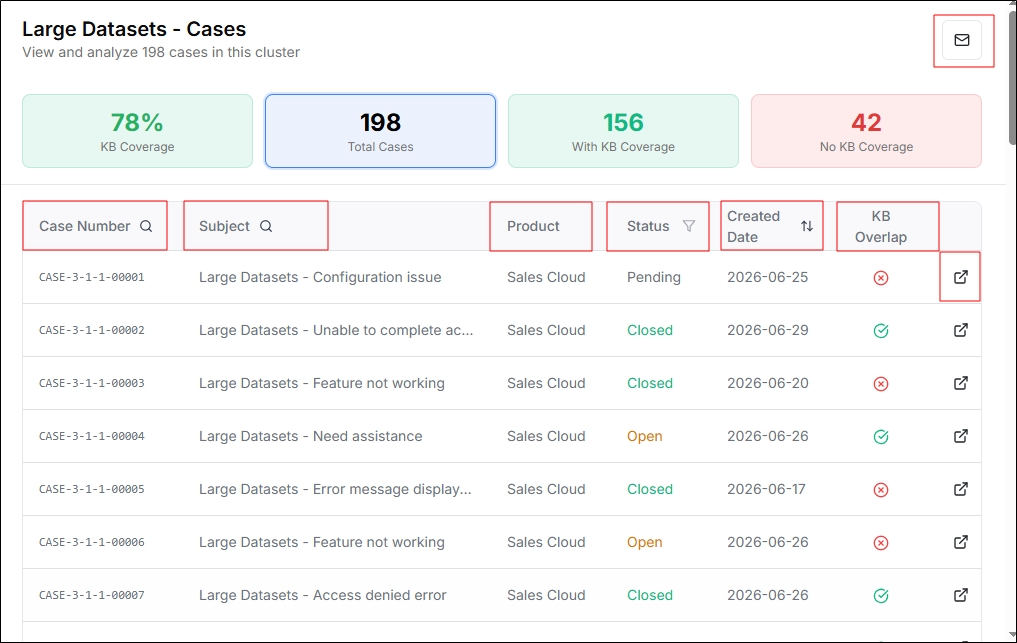
Clicking it opens a new dialog where you can see four tabs and a table.
The table is dynamic. You can change its value by clicking
any of the following tabs: Total Cases, With KB Coverage,
No KB Coverage. The fourth tab KB Coverage is static and
it displays the coverage.
Fig. A snapshot of the Case Details screen.
The table has teh following columns:
Case Number: The ID of the logged case. This column is searchable.
Subject: The subject of the logged case. This column is searchable.
Product: The field value of the case.
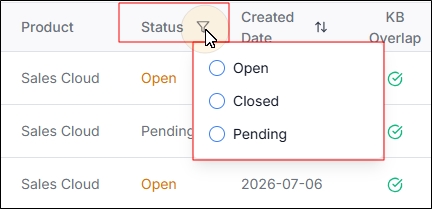
Status: It can be Open, Closed, or Pending. The column can be filtered using those values.
Created Date: The date when the case was logged. This column is sortable.
KB Overlap: Here, the green icon means that a knowledge article exists for this case and a red icon means that a knowledge article doesn't exist for this case. Clicking the Arrow icon in the KB Overlap column, you can view the case in your case management platform.
Email: Click on the Email icon to send the Cases Data to your email address.
To send the case data on the side-drawer to yourself, click Email and enter your email address.
Fig. A snapshot of the Email button on the side-drawer.
View Articles
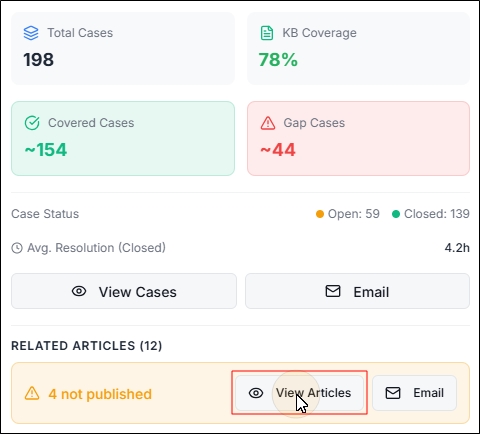
You can view the knowledge articles that exist for a given cluster but haven’t been published, click on
View Articles.
Fig. A snapshot of the View Articles button on the side-drawer.
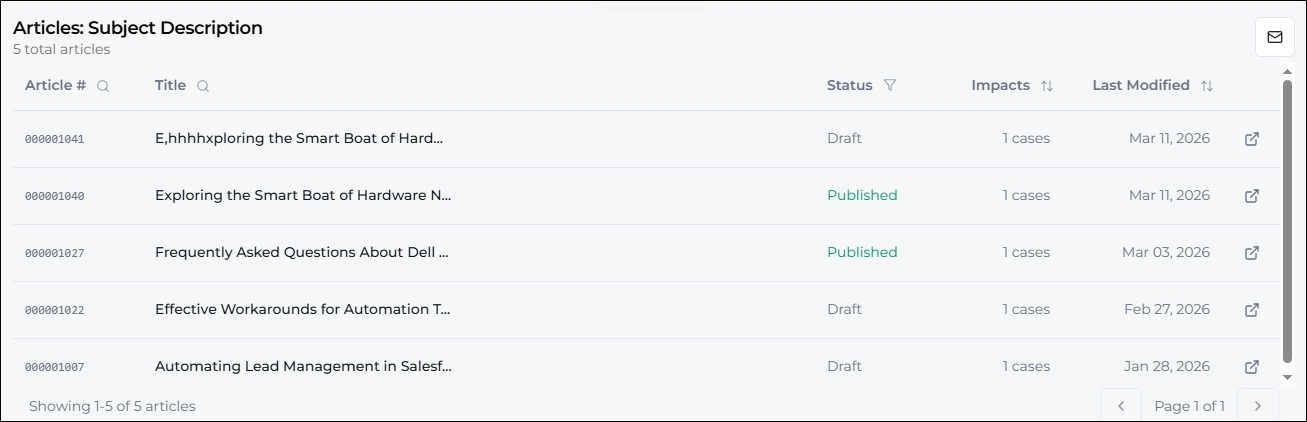
The articles screen has the following columns:
Fig. A snapshot of the seven columns in the "View Articles" side-drawer.
The columns display the following information:
Article#: The ID of the knowledge article. This column is searchable.
Title: The title of the knowledge article. This column is searchable.
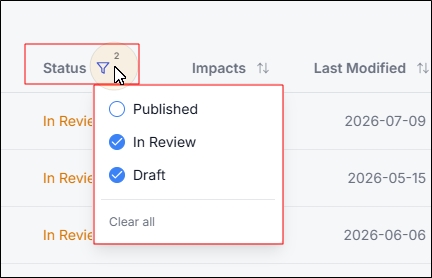
Status: This column can take one of the three values:
Draft, In Review, and Published. This column is filterable.
Impact: The number of cases that can be solved by the knowledge article. This column is sortable.
Last Modified: The last time the knowledge article was updated.
Click on the Arrow icon to view the knowledge article in your Knowledge Management System.
To send the article data on the side-drawer to yourself, click Email and enter your email address.
Fig. A snapshot of the Email button on the side-drawer.