LLM Usage Dashboard
The LLM Usage Dashboard allows you to monitor token usage across Large Language Models (LLMs).
PREREQUISITES
To access the LLM Usage Dashboard, ensure the following:
You must have at least one active Knowbler client.
You must have at least one active LLM integration.
LLM is supported only for Salesforce and Zendesk.
Access LLM Usage Dashboard
Follow these steps to access the dashboard:
-
Navigate to Large Language Model and select Usage Dashboard.
-
Depending on your setup, you will either see the message "LLM Integration is not activated" or the dashboard with two reports and two filters.
-
Use the following filters to generate reports:
-
Service Desk Management Tool
-
Date Range
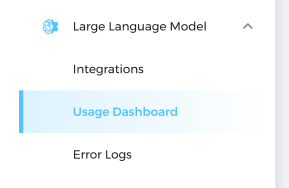
Fig. A snapshot of the Usage Dashboard in Knowbler.
-
Report Total Requests
The first report, Total Requests, displays the total number of calls made to an LLM. By default, this report is collapsed.

Fig. A snapshot of the Total Requests report in the collapsed state.
Expand the Total Requests report to view the following columns:
-
Serial Number: The row number.
-
Requester Email: The email address of the support representative who clicked "Create an Article" in Knowbler while connected to an LLM. (Searchable)
-
Case ID: The case ID.
-
Case Subject: The title of the case.
-
Requested Time: The timestamp when the "Create an Article" action was triggered in Knowbler.
The Requester Email, Case ID, and Case Subject columns are searchable. By default, the report lists 10 rows. The data can be downloaded or emailed for further analysis.
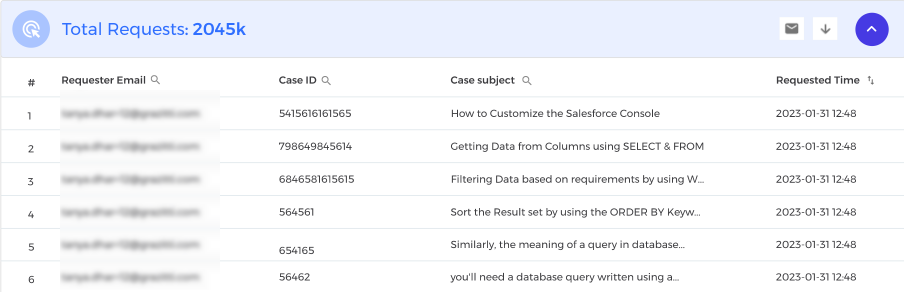
Fig. A snapshot of the Total Requests report in the expanded state.
Four Tiles
The second section of the dashboard includes four (or sometimes five) tiles summarizing key metrics:
-
Input Tokens: The total number of tokens sent from Knowbler to an LLM.
-
Generated Tokens: The total number of tokens received from an LLM by Knowbler.
-
Average LLM Response Time: The average time (in milliseconds) taken by the LLM to respond to requests.
-
Error Rate: The ratio of failed requests to total requests.
NOTE.
A fifth, Integration tile, is displayed only when multiple LLM integrations are active.
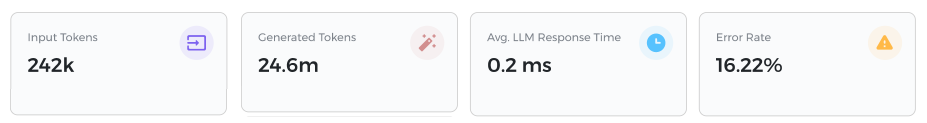
Fig. A snapshot of the second section of the Total Requests report which has four tiles.
API Consumption
NOTE.
This report is only for Claude integrations.
Each Knowbler customer is allocated a fixed number of tokens per month. The API Consumption section allows you to monitor token usage for the current month or any of the previous six months.
-
Green Bar: Usage is less than the allocated quota.
-
Blue Bar: Usage is nearing the allocated quota.
-
Red Bar: Usage has exceeded the monthly quota
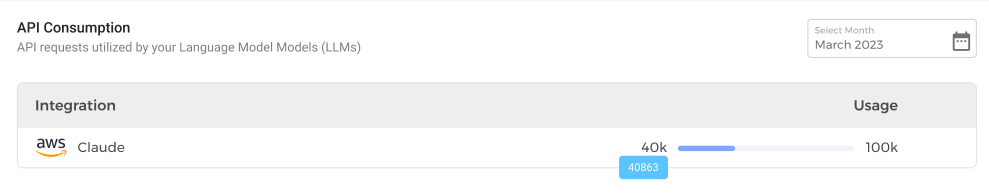
Fig. A snapshot of the API Consumption report in Usage Dashboard.
Notifications are sent via email when token usage reaches 50%, 90%, and 100% of the monthly quota. If the quota is exceeded, contact your Customer Success Manager (CSM) to continue usage.
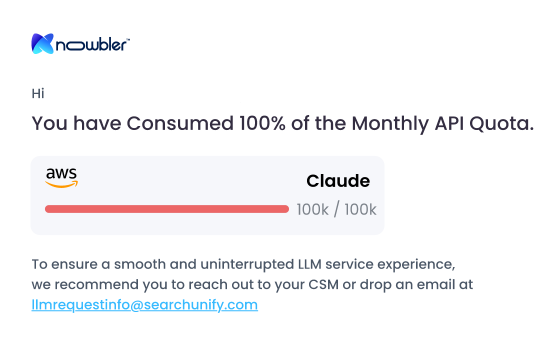
Fig. A snapshot of the "Monthly API Quota is exhausted." email.